AV & EV Sentiment Indices FAQ
- What are the AV & EV Sentiment Indices?
The indices track the sentiment (positive, neutral, or negative) expressed in tweets posted on twitter where the subject is either Automated Vehicles or Electric Vehicles. Separate analyses and indices are kept for each of these two subjects.
- What is displayed on the web pages?
There are two web pages, one for Automated Vehicle Sentiment and one for Electric Vehicle Sentiment. The type of data displayed is the same for each case:
- Current Average Sentiment, on a scale of -1 to 1. This calculates the mean of the twitter sentiment collected on the most recent day, with negative tweets counting as -1, neutral tweets as 0, and positive tweets as 1.
- Positive / Negative Ratio of tweets: For this metric, the neutral tweets are discarded, and the ration of positive to negative tweets for the most recent day is reported.
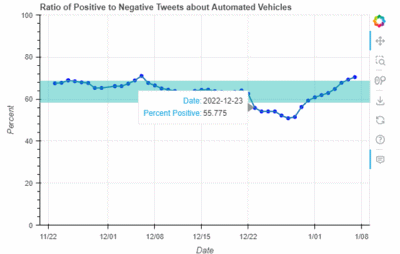
- Time series graph of the positive / negative ratio: This plots the daily changes in the ratio. The blue bands show 1 and 2 standard deviations from the mean.
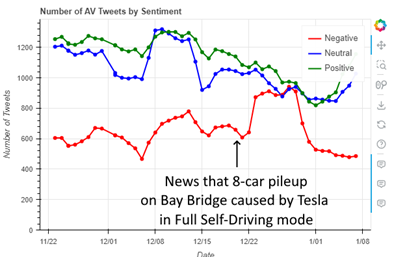
- Time series graph of the tweets of each type: This plots the daily changes in the number of positive, neutral, and negative tweets.
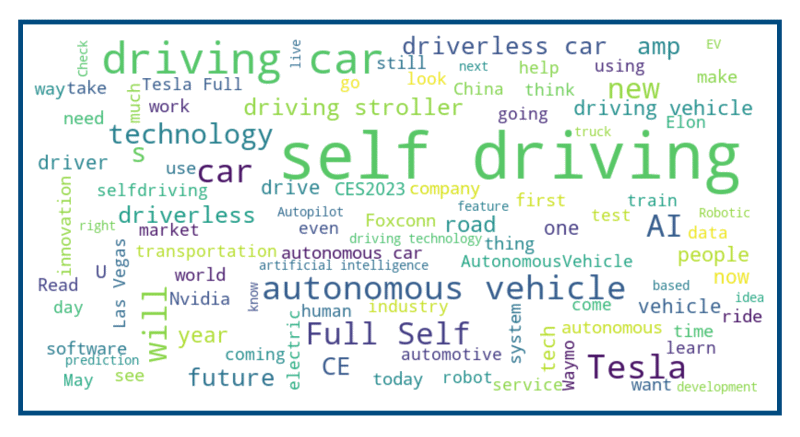
- Word Cloud: The 100 most popular one or two word phrases appearing in tweets about the subject matter.
- Donut Chart: This shows the current percentages of positive, negative, and neutral tweets for the current day.
- What’s Hot / What’s Not: This analysis captures the 100 most frequently seen one and two word phrases from all the tweets for the day.
Then, the top 5 found in the current day but missing from the top 100 of a week ago are listed under “What’s Hot” and conversely, the top 5 words found a week ago but missing from the top 100 in the current list are listed under “What’s Not.”
- What is Sentiment Analysis and how is it calculated?
Wikipedia defines sentiment analysis as the use of natural language processing, text analysis, computational linguistics, and biometrics to systematically identify, extract, quantify, and study affective states and subjective information. In this case, the Twitter API is used to extract tweets that,
based on the presence of key words, appear to be discussion either Automated Vehicles or Electric Vehicles. Then, for each of these tweets, the contents of the tweet is analyzed to determine the polarity (positive, neutral, or negative) of the sentiment expressed on the subject matter. Because this is highly labor intensive if done by hand, computer algorithms are used to identify the polarity of each tweet.
There are multiple approaches for using computers to automate sentiment analysis, including various machine learning algorithms and neural networks. The AV and EV sentiment indices
used here are calculated using
VADER (Valence Aware Dictionary and sEntiment Reasoner), an open source software package. VADER is a lexicon and rule-based analysis tool that was specifically developed to perform well when analyzing social media posts such as tweets. Some minor additions were made to the lexicon to tailor it to the current subject matter.
This rule-based approach is rather simple when compared with some of the other approaches, however comparison studies have shown that it often performs as well or better than other approaches when analysis social media and it has the advantage of running very quickly.
- Why analyze tweets?
Twitter has hundreds of millions of users. Even though only a small percentage tweet about either automated or electric vehicles, the result is still thousands of new tweets per day on the subjects. This analysis uses the Twitter API to collect a sample of up to 5,000 new tweets on each of the two subjects, once per day. It provides a large sampling of opinions, and these are readily accessed through their open API,
simplifying automation.
Tweets have disadvantages as well, however. Many bots simply repeat news posts from other sources, resulting in identical or (worse) nearly identical tweets that are simply repeats. Custom code in the AV and EV sentiment index analysis attempts to filter these out.
In addition, the search parameters to collect the sample exclude retweets,
replies, and quote tweets, so that only new, original tweets are collected
and analyzed.
- How accurate is sentiment analysis?
Machine based sentiment analysis can be difficult. Tweets can include negated words (“not good” is negative, whereas “good” is positive), slang words, emojis, and sarcasm. VADER is designed to handle many of these cases, but it is far from perfect. In fact, research has shown that human raters only agree with one another 80% of the time.
With three sentiment values distributed roughly equally, random chance would get about 30% right. When tested using a similar, but slightly different set of tweets concerning automated vehicles that had been labeled by humans, the algorithm had an accuracy of 53%.
The goals of the indices, however, is not to get a precise value of the sentiment polarity, but rather to track changes over time, and how these changes correlate with external events.
- Is the time series data actually able to capture trends and events?
Yes!
This is not the first time that the impact of events, such as crashes, has
on Twitter sentiment (see, for example,
Jefferson and Mcdonald, 2019). However, past work has tailored search
terms specificallly to collect tweets that mentioned the incidents (e.g.,
including "Volvo XC40" as a search term after a fatal Uber self-driving
incident, or "Tesla" after a Tesla crash. This current work uses constant
search terms for tweets about AVs and EVs, rather than tailoring search
terms for each incident. So it was an open question whether or not a
significant change in sentiment would be detected after an incident.
The first six weeks of data collection of the earlier version of this
analysis (which analyzed tweets sampled from the previous seven days, rather
than one day, as is done now) coincided with news reports of a Tesla in Full Self-Driving mode causing an 8 car pile-up on the San Francisco Bay Bridge. The data shows a large spike in negative tweets about Automated Vehicles beginning at that time and lasting for about a week, as shown in Figure 1,
which shows the number of AV tweets by sentiment, including the spike in
negative tweets after a crash involving a Tesla in self-driving mode
appeared in the news. While based on limited data to-date, at peak negativity, the ratio of positive to negative tweets dropped by two standard deviations from the mean, as shown in Figure 2,
which shows the ratio of positive to negative tweets. The blue band in the
figure shows + / - one standard deviation. The ratings dropped even lower on December 28th, when California announced that Tesla would be banned using the term “full self driving” in it’s advertising.
Interestingly, another crash involving a Tesla occurred the first week of January. In that crash, a Tesla ran over a cliff. However, it was quickly reported that the crash did not involve the self-driving features, and this crash does not appear to have impacted the sentiment on Twitter.
- Is the data archived, and is there a way to access
it?
The full content of the sampled tweets are archived so that they are available for additional analysis.
They are not published on the website because this would violate Twitter's
Terms of Service. However the 100 one and two word n-grams that most commonly occur in the
sampled tweets for each day is both archived and, for the current day, provided on the web pages, along with the number of positive, negative, and neutral tweets and the computed score and positive / negative ratio.
The new words appearing or disappearing from the top 100 words for any two given dates can be calculated from the archived data.
- Why hasn't the data been updated since early
June 2023?
The analysis had been updated daily from late
February 2022 through early June 2023. The data is currently not updated
because of changes made to Twitter's API, including charging $100 a month
for the formerly free access that is required.
If you are interested in the analysis reports or the archived data or have other questions, please see
the archives for McGurrin Consulting.