Introduction
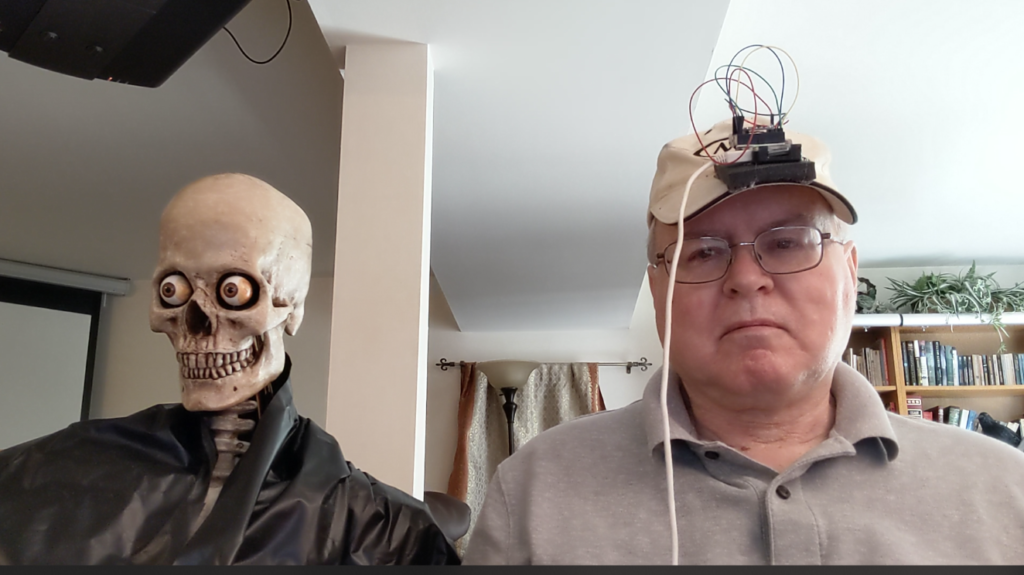
The sensor cap and the skull it wirelessly controls.
A few years back I presented my Yorick Alexa project at a local Hack & Tell meeting. At the meeting, someone asked if I could hook up a microphone to provide the voice, rather than Alexa. That is a pretty trivial change (much easier than getting Alexa interfaced in the first place), but from that I had the idea of capturing a person’s head motions for the skull in real-time, rather than using pre-canned, repeated routines. This Mimic project was the result.
This project uses two Raspberry Pi’s, communicating over WiFi using XMLRPC, along with an Inertial Measurement Unit (IMU) sensor and a Maestro Servo Controller to have a 3-axis skull wirelessly mimic the head movements of the operator, who is wearing a baseball cap with the sensor Pi and IMU unit mounted on the brim. (A shoutout to Greg G on Haunt Forum for the ball cap mount idea).
Side note: My first job out of college was as a systems engineer on the Shuttle Mission Simulator, including the simulation code for the rate gyro assemblies and the on-board accelerometers. There, I first heard of this weird thing called a “quaternion.” Now, over 40 years later, here I am using them in a hobby project!
Overview
This project has two units, a sensor unit and a controller unit. The sensor unit consists of a Raspberry Pi Zero W and an Adafruit BNO055 9 degree of free
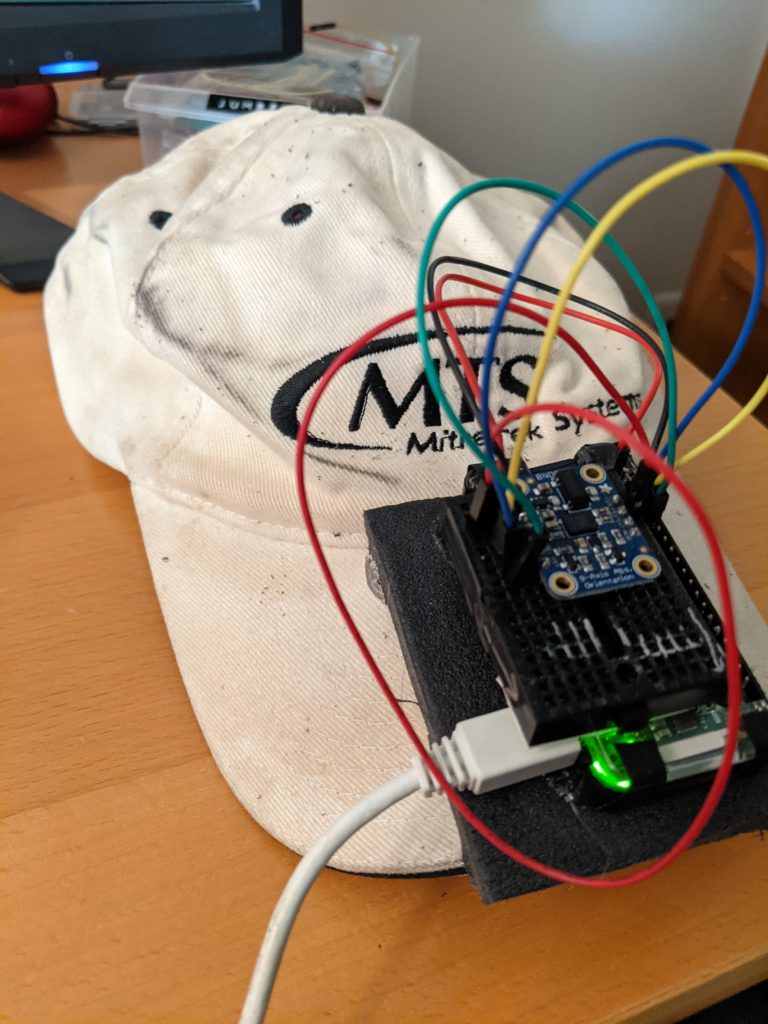
Sensor unit mounted on a baseball cap
dom IMU Board. The controller unit consists of another Pi Zero W and a Pololu Maestro Servo Controller.
The project has two units: the sensor unit and the controller unit. The Sensor unit consists of a Raspberry Pi Zero W and an Adafruit BNO055 9-Degrees of Freedom IMU board. The controller unit consists of another Pi Zero W and a Pololu Maestro Servo Controller. The two communicate with each other using XMLRPC running over WiFi. The Sensor unit acts as the server and the Controller unit acts as the client.
I mounted the sensor Pi and IMU board on the brim of a baseball cap, so it will track my head movements.
The code for the project is open source, of course, and posted on GitHub.
How it Works
The IMU board has a triaxial accelerometer, a triaxial gyroscope, and a triaxial magnetometer. The magnetometer provides orientation relative to magnetic north and is not used in the IMU only mode used in this project, as only relative orientation to the starting position (which should be looking straight forward and level) is desired. The accelerometers and gyroscope. The secret sauce in this board is that it includes a high speed ARM Cortex-M0 based processor that takes in the raw data from all the sensors, fuses it, and outputs the calculated orientation in real-time.
The orientation is provided as Euler angles (think roll, pitch, yaw rotations about the board’s x, y, and z axes), as the x, y, and z components of the gravitational force vector, or as a quaternion (which defines the direction of a single rotation axis and the amount of rotation about that axis). Unfortunately the chip has some flaws in calculating Euler angles, so it’s safer to use the quaternion output. For this project, the aviation convention is used for angles (x axis looking forward, y axis pointing right, and z axis down). Note however, that some of the servos move in the opposite direction, so you’ll see some sign changes in the function that converts the angles to actual servo commands).
For moving the skull, we want the Euler angles, though, to command the tilt, nod, and turn servos of the skull. Fortunately it’s easy to find the math to implement to convert the quaternion value provided into the proper Euler angles.
In this project, the sensor Pi is set up to be an XMLRPC server which, when receiving the appropriate XMLRPC request, queries the board for the current orientation, provided as a quaternion, and wirelessly sends this to the controller Pi that made the request.
The controller Pi makes this request 50 times per second. Once it has the quaternion, it converts it to the three Euler angles, and then converts each angle into the appropriate servo command to pass on to the maestro.py module that communicates with the Maestro servo controller. In addition, there is a subroutine that sends commands to move the eyes servo in a pre-determined, but relatively random, fashion.
This video [[[[[insert] shows the system in action. The goal is not to get perfectly synchronized motion between the operator and the skull, as the servos will always introduce significant delay. Rather, the intent is to generate spontaneous and realistic movements by capturing the motion of the operator, who normally will be out of sight.
Software Prerequisites
The sensor software uses CircuitPython and Adafruit’s Blinka library must be installed to support CircuitPython on a Pi. In addition, the adafruit_bno055 program is needed to interface with the board. Be sure to use the CircuitPython version rather than the earlier version.
Hardware
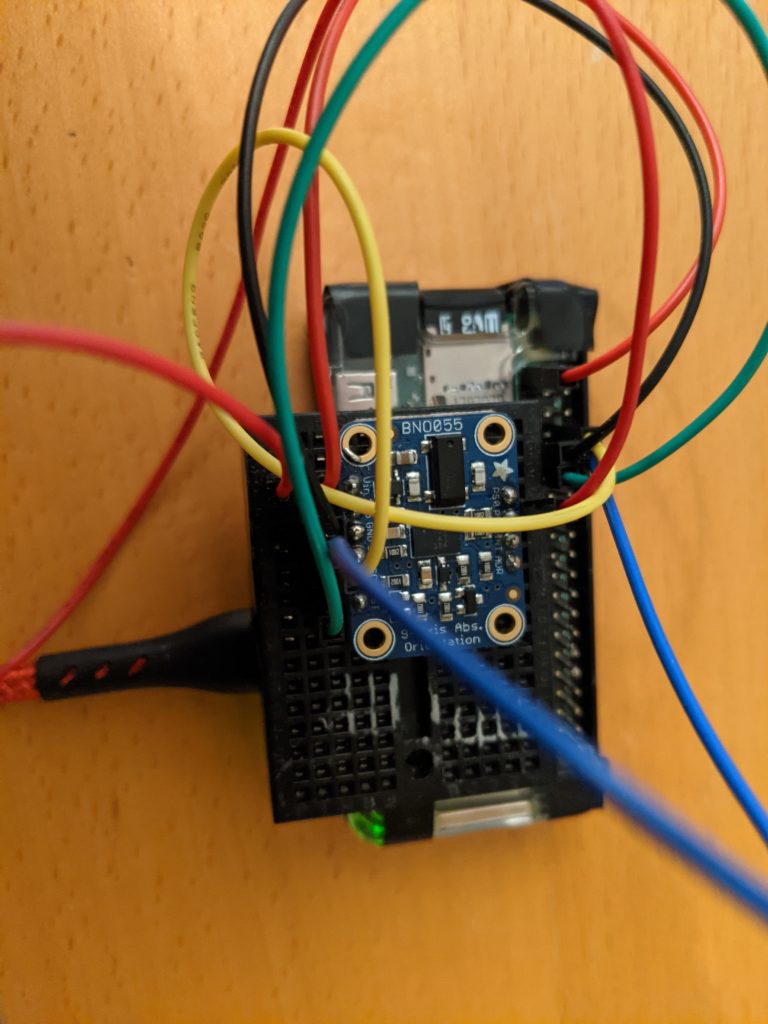
Closeup of the BNO055 sensor and Pi Zero sensor unit
This project requires two Raspberry Pi’s with WiFi (I used Pi Zero W’s), an Adafruit BNO055 IMU board, and a Pololu Maestro Servo Controller to control the motions of a 3-axis skull. You also need some jumper wires and a USB OTG cable. The OTG cable is used to connect the controller Pi to the Maestro Servo Controller.
Sensor
The sensor unit captures the operator’s head movements. The sensor software is just one program, imu_rpc_server.py. It is configured to use a UART interface to the BNO055 board. One can use an i2c interface instead by changing a few line at the top of the program, however all Raspberry Pi’s have a hardware issue with i2c clock stretching, and the sensor board uses clock stretching. This gave extremely unreliable results when I was developing this software and I put the entire project aside for months until I came back and found out about the hardware issue. There is a workaround that you can use if you want to use i2c that consists of slowing the speed down so that clock stretching will rarely (hopefully never) be needed. You can read more about the issue here: https://www.mcgurrin.info/robots/723/.
Normally when the Pi kernel boots up it will put a login terminal on the serial port. You’ll need to turn this off if using the UART interface. To do so, you can run the raspi-config tool and go to Interface Options, then to Serial Port, and disable shell messages on the serial connection. Then reboot the Pi. If you later need to re-enable it, just follow the same procedure. To wire up the sensor board and the Pi using the UART interface:
- Connect BNO055 Vin to Raspberry Pi 3.3V power
- Connect BNO055 GND to Raspbery Pi ground
- Connect BNO055 SDA (now UART TX) to Raspberry Pi RXD pin
- Connect BNO055 SCL (now UART RX) to Raspberry Pi TXD pin
- Connect BNO055 PS1 to BNO055 Vin / Raspberry Pi 3.3V power
You can test that everything is working by running the simpletestuart.py program. It will print out the temperature of the board, the individual sensor parameters, and the integrated Euler angle and Quaternion values, as well as the calibration status and the axis map. This will update every 5 seconds. Don’t worry that the magnetometer readings will be None. This project uses relative orientation and therefore the software turns off the magnetometer. For more information on the board and the various outputs and settings, see the datasheet.
The imu_rpc_server.py program is similar to the test program, but it only reads the quaternion values (the Euler angles are unreliable on this sensor). It also starts and XMLRPC server that will respond to read_sensor requests by returning the quaternion value for the current orientation. The program, once started runs continually until forced closed.
Controller
The controller software runs on a different Pi, and consists of two programs: main_controller.py and maestro.py. Main_controller.py initializes the servo controller and sets limits on the speed and acceleration for the servos. I found this cuts down on the noise of the servos, provides smoother motion, and keeps the head from whipping around when turning.
The board queries the sensor Pi via XMLRPC ten times per second to get the position as a quaternion. It converts the quaternion into Euler angles and converts the Euler angles into servo commands and sends the servo commands to the Maestro board. It also generates a sequence of eye movements and sends that to the Maestro as well.
ManServoTest can be used as you set things up to make sure your controller Pi is talking to the Maestro correctly.
Use
Set up the Pi’s to connect to your local WiFi network and install CircuitPython on the sensor Pi (it’s not needed for the controller). Then install the appropriate modules on each one. Connect the sensor Pi to the BNO055 and connect the controller Pi to the Maestro Servo Controller using a USB OTG cable. And, of course, connect the appropriate pins on the servo controller to the servos controlling your skull. Roll or tilt is channel 0, pitch or nod is channel 1, yaw or pan is channel 2, and random eye movements are sent out on channel 3.
Once everything is hooked up, you must start imu_rpc_server.py on the sensor pi first, so that it starts the XMLRPC server. Then launch main_controller.py on the controller Pi and you’re off and running.
Opportunities for Expansion
It would be very straightforward to take the sensor software and use it to capture and record head motions to a file. Then a different program could read back the file and send out the previously captured motion commands.
A somewhat more complex undertaking would be to capture the motions as described above, but then translate them into the scripting language used on the Maestro servocontroller, so that they could be played back without a Pi or other computer. Sending out 50 commands per second, however, would quickly fill the limited memory of the Maestro. Instead, one would want to pre-process the motion file so that only key commands are kept (analogous to keyframe animation) and only those key commands translated to the Maestro’s scripting language.